Trending
As ‘Climate Change’ Activism Grows, Global Livestock Industry Supports Livelihoods Of 1.3 Billion People

Combined together, meat, dairy, and eggs make up nearly 18% of the average person’s diet.
But, as Visual Capitalist’s Pallavi Rao details below, in order for these meat and animal products to reach consumers, a vast global livestock industry – one supporting the livelihoods of 1.3 billion people globally – operates in fields and farms largely unseen from major cities.
So where are the various types of livestock concentrated in the world? And how do national consumption habits influence animal husbandry?
These maps from Adam Symington help to answer these questions, using the Gridded Livestock of the World database from the UN Food and Agriculture Organization (FAO), which models livestock densities from 2010 around the world.
Chicken, Beef, and Pork Livestock Density
As a starting point, it’s worth noting that the above map of all livestock might seem reminiscent to a human population density map.
Though there is definite correlation, especially when it comes to natural obstacles for both humans and livestock like deserts, forests, and mountain ranges, the concentration of livestock spreads far further than the densest human cities.

We dive into each category of livestock below.
Chicken Livestock Density
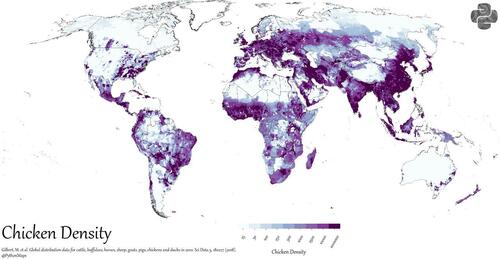
The UN FAO estimates that the world produced more than 121 million tonnes of chicken meat in 2021, making it the world’s most harvested meat. Chicken eggs are also estimated to account for 93% of the world’s 86 million tonnes of poultry eggs.
These numbers and the map below help illustrate the sheer number of chickens needed to support the world’s appetite for chicken goods.
Click to view this graphic in a higher-resolution.
Just by glancing at the heatmap map of chicken distribution, two things stand out clearly. First is how ubiquitous chickens are, with a high density of chicken livestock in almost all of the world’s populated regions.
But the map also gives us insight into where most farms are located. In the U.S. for example, Southern states including Georgia, North Carolina, Alabama, Mississippi, and Arkansas are major chicken producers. Likewise in countries like Brazil and China, the chicken industry can be seen continuing inland far beyond the more populated coastal regions.
Pig Livestock Density
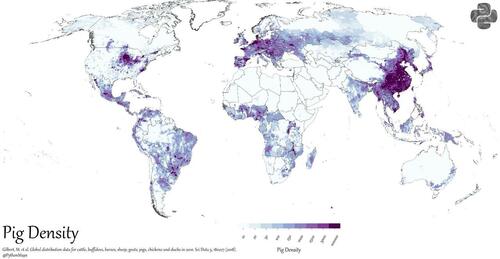
Shifting attention to pig livestock, we see densities begin to concentrate in a few specific regions.
Click to view this graphic in a higher-resolution.
China stands out on the map with large concentrations of pig livestock, which comes as no surprise given the country is far and away the world’s top producer of pork.
Also clear is the regionality of pork consumption. The U.S. has a strong concentration of pig livestock in the Midwest, while Central Europe has multiple countries with a noted history of pork consumption including Germany and Poland. Finally, partially thanks to its premium production of jamón ibérico, the country of Spain also stands out.
On the flip side, there is a clear absence of pig-rearing in countries of Islamic faith, across North Africa, the Middle East, and Central Asia, reflecting their religious prohibition.
Cattle Livestock Density
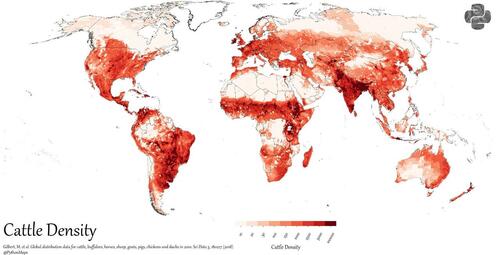
In contrast, the map of cattle distribution more closely mirrors chicken distribution, though its footprint is considerably wider.
Click to view this graphic in a higher-resolution.
Major cow byproducts like milk and leather, as well as the sheer strength of cattle, make them vital livestock even for countries that don’t consume a lot of beef. The FAO estimates that the world produced 746 million tonnes of raw cattle milk in 2021 alone.
On the map, the largest producers of cattle stand out. India for example is the top producer of milk and the fourth-largest producer of cattle meat, and has a high density of cattle throughout populated and agricultural regions. Brazil, also a top four producer of cattle meat and milk, has pockets of high density cattle regions inland, notably encroaching into the Amazon rainforest.
Meanwhile, the U.S. is the world’s largest producer of beef and second largest of milk, but it does this with a more distributed cattle population throughout the country’s landmass, and fewer high-density hot spots.
Chicken, Pork, and Beef Production by Country
Here’s a breakdown of chicken, pork, and beef production by country in 2021:
| Country | Chicken (Tons) | Pig (Tons) | Cattle (Tons) |
|---|---|---|---|
| 🇦🇫 Afghanistan | 28,029 | N/A | 115,282 |
| 🇦🇱 Albania | 13,250 | 9,370 | 31,712 |
| 🇩🇿 Algeria | 257,645 | 104 | 146,270 |
| 🇦🇴 Angola | 39,951 | 136,388 | 108,790 |
| 🇦🇬 Antigua & Barbuda | 34 | 50 | 57 |
| 🇦🇷 Argentina | 2,294,101 | 695,939 | 2,981,690 |
| 🇦🇲 Armenia | 8,268 | 18,883 | 57,448 |
| 🇦🇺 Australia | 1,292,240 | 432,246 | 1,932,598 |
| 🇦🇹 Austria | 129,390 | 502,120 | 213,740 |
| 🇦🇿 Azerbaijan | 124,388 | 497 | 145,040 |
| 🇧🇸 Bahamas | 6,204 | 376 | 19 |
| 🇧🇭 Bahrain | 8,262 | N/A | 816 |
| 🇧🇩 Bangladesh | 216,198 | N/A | 198,544 |
| 🇧🇧 Barbados | 13,183 | 2,634 | 161 |
| 🇧🇾 Belarus | 503,200 | 395,800 | 348,500 |
| 🇧🇪 Belgium | 447,710 | 1,140,090 | 247,120 |
| 🇧🇿 Belize | 19,187 | 1,899 | 1,536 |
| 🇧🇯 Benin | 16,005 | 8,850 | 34,158 |
| 🇧🇹 Bhutan | 1,866 | 700 | 1,016 |
| 🇧🇴 Bolivia | 506,148 | 115,095 | 284,195 |
| 🇧🇦 Bosnia & Herzegovina | 63,703 | 8,364 | 12,355 |
| 🇧🇼 Botswana | 4,019 | 225 | 34,000 |
| 🇧🇷 Brazil | 14,636,478 | 4,365,000 | 9,750,000 |
| 🇧🇳 Brunei Darussalam | 31,353 | 31 | 3,465 |
| 🇧🇬 Bulgaria | 90,680 | 80,650 | 18,180 |
| 🇧🇫 Burkina Faso | 204,218 | 337,410 | 110,204 |
| 🇧🇮 Burundi | 8,267 | 10,678 | 14,192 |
| 🇨🇻 Cabo Verde | 706 | 2,413 | 686 |
| 🇰🇭 Cambodia | 17,400 | 107,364 | 52,168 |
| 🇨🇲 Cameroon | 85,261 | 29,349 | 84,880 |
| 🇨🇦 Canada | 1,332,968 | 2,404,595 | 1,385,544 |
| 🇨🇫 Central African Republic | 6,599 | 19,079 | 102,626 |
| 🇹🇩 Chad | 6,596 | 2,558 | 491,711 |
| 🇨🇱 Chile | 680,290 | 589,585 | 209,972 |
| 🇨🇳 China | 14,700,000 | 52,959,300 | 6,975,100 |
| 🇨🇴 Colombia | 1,694,335 | 460,707 | 758,737 |
| 🇰🇲 Comoros | 570 | N/A | 1,227 |
| 🇨🇬 Congo | 6,812 | 1,557 | 5,669 |
| 🇨🇰 Cook Islands | 15 | 409 | 3 |
| 🇨🇷 Costa Rica | 147,816 | 66,065 | 92,794 |
| 🇨🇮 Côte d’Ivoire | 70,084 | 11,589 | 37,587 |
| 🇭🇷 Croatia | 58,610 | 122,500 | 43,180 |
| 🇨🇺 Cuba | 24,000 | 124,252 | 62,032 |
| 🇨🇾 Cyprus | 26,640 | 43,710 | 5,910 |
| 🇨🇿 Czechia | 167,980 | 225,880 | 74,520 |
| 🇩🇰 Denmark | 163,100 | 1,723,730 | 123,430 |
| 🇩🇯 Djibouti | N/A | N/A | 6,154 |
| 🇩🇲 Dominica | 368 | 425 | 564 |
| 🇩🇴 Dominican Republic | 346,883 | 76,228 | 62,317 |
| 🇨🇩 DRC | 10,532 | 30,073 | 21,116 |
| 🇪🇨 Ecuador | 437,094 | 224,040 | 229,014 |
| 🇪🇬 Egypt | 2,232,206 | 752 | 352,383 |
| 🇸🇻 El Salvador | 133,628 | 6,255 | 16,713 |
| 🇬🇶 Equatorial Guinea | 261 | 178 | 48 |
| 🇪🇷 Eritrea | 1,083 | N/A | 24,333 |
| 🇪🇪 Estonia | 23,300 | 44,150 | 9,950 |
| 🇸🇿 Eswatini | 5,783 | 1,420 | 16,815 |
| 🇪🇹 Ethiopia | 70,081 | 2,268 | 440,736 |
| 🇫🇴 Faroe Islands | N/A | N/A | 93 |
| 🇫🇯 Fiji | 25,715 | 4,094 | 3,989 |
| 🇫🇮 Finland | 138,600 | 176,080 | 86,250 |
| 🇫🇷 France | 1,143,000 | 2,203,830 | 1,424,320 |
| 🇵🇫 French Polynesia | 595 | 848 | 205 |
| 🇬🇦 Gabon | 4,119 | 3,580 | 1,105 |
| 🇬🇲 Gambia | 1,630 | 505 | 4,321 |
| 🇬🇪 Georgia | 25,000 | 21,800 | 20,500 |
| 🇩🇪 Germany | 1,080,000 | 4,971,150 | 1,080,420 |
| 🇬🇭 Ghana | 74,124 | 29,448 | 26,344 |
| 🇬🇷 Greece | 235,500 | 74,820 | 33,050 |
| 🇬🇩 Grenada | 539 | 237 | 137 |
| 🇬🇹 Guatemala | 361,187 | 38,185 | 215,337 |
| 🇬🇳 Guinea | 13,572 | 7,606 | 103,056 |
| 🇬🇼 Guinea-Bissau | 3,059 | 14,106 | 7,474 |
| 🇬🇾 Guyana | 48,945 | 839 | 2,071 |
| 🇭🇹 Haiti | 8,750 | 32,388 | 49,028 |
| 🇭🇳 Honduras | 228,241 | 9,731 | 66,000 |
| 🇭🇰 Hong Kong | 32,967 | 117,808 | 6,659 |
| 🇭🇺 Hungary | 367,610 | 473,800 | 30,080 |
| 🇮🇸 Iceland | 8,997 | 6,580 | 4,965 |
| 🇮🇳 India | 3,670,156 | 320,228 | 4,195,000 |
| 🇮🇩 Indonesia | 3,844,346 | 323,670 | 437,783 |
| 🇮🇷 Iran | 1,983,328 | N/A | 336,332 |
| 🇮🇶 Iraq | 122,411 | N/A | 34,783 |
| 🇮🇪 Ireland | 147,770 | 335,130 | 594,510 |
| 🇮🇱 Israel | 541,292 | 13,400 | 139,716 |
| 🇮🇹 Italy | 1,068,500 | 1,351,980 | 747,890 |
| 🇯🇲 Jamaica | 125,192 | 7,199 | 6,545 |
| 🇯🇵 Japan | 2,435,965 | 1,318,125 | 477,979 |
| 🇯🇴 Jordan | 205,000 | N/A | 48,581 |
| 🇰🇿 Kazakhstan | 263,561 | 83,745 | 540,216 |
| 🇰🇪 Kenya | 89,450 | 23,107 | 250,607 |
| 🇰🇮 Kiribati | 983 | 1,046 | N/A |
| 🇰🇼 Kuwait | 64,604 | N/A | 2,265 |
| 🇰🇬 Kyrgyzstan | 11,057 | 10,679 | 111,226 |
| 🇱🇦 Laos | 38,318 | 101,560 | 39,463 |
| 🇱🇻 Latvia | 35,080 | 37,850 | 17,040 |
| 🇱🇧 Lebanon | 113,997 | 695 | 45,513 |
| 🇱🇸 Lesotho | 932 | 526 | 1,402 |
| 🇱🇷 Liberia | 14,725 | 11,307 | 1,236 |
| 🇱🇾 Libya | 127,566 | N/A | 5,857 |
| 🇱🇹 Lithuania | 85,030 | 79,210 | 45,540 |
| 🇱🇺 Luxembourg | N/A | 12,550 | 10,590 |
| 🇲🇴 Macao | 3,278 | 5,000 | 755 |
| 🇲🇬 Madagascar | 52,861 | 19,226 | 34,386 |
| 🇲🇼 Malawi | 107,501 | 279,891 | 60,894 |
| 🇲🇾 Malaysia | 1,558,809 | 219,179 | 34,810 |
| 🇲🇱 Mali | 60,450 | 683 | 55,738 |
| 🇲🇹 Malta | 4,070 | 4,720 | 1,050 |
| 🇲🇷 Mauritania | 4,309 | N/A | 31,255 |
| 🇲🇺 Mauritius | 49,100 | 640 | 1,711 |
| 🇲🇽 Mexico | 3,668,552 | 1,693,007 | 2,130,592 |
| 🇫🇲 Micronesia | 161 | 1,085 | 261 |
| 🇲🇩 Moldova | 50,106 | 51,836 | 7,711 |
| 🇲🇳 Mongolia | 246 | 253 | 114,485 |
| 🇲🇪 Montenegro | 3,601 | 4,204 | 3,718 |
| 🇲🇦 Morocco | 525,000 | 629 | 282,000 |
| 🇲🇿 Mozambique | 135,708 | 127,089 | 17,781 |
| 🇲🇲 Myanmar | 620,000 | 285,000 | 110,000 |
| 🇳🇦 Namibia | 10,466 | 7,089 | 32,936 |
| 🇳🇷 Nauru | 4 | 76 | N/A |
| 🇳🇵 Nepal | 226,959 | 31,450 | N/A |
| 🇳🇱 Netherlands | 869,380 | 1,719,420 | 429,640 |
| 🇳🇨 New Caledonia | 1,018 | 2,892 | 3,076 |
| 🇳🇿 New Zealand | 226,259 | 44,917 | 750,549 |
| 🇳🇮 Nicaragua | 143,284 | 14,366 | 167,369 |
| 🇳🇪 Niger | 20,268 | 1,540 | 69,645 |
| 🇳🇬 Nigeria | 241,188 | 309,582 | 334,333 |
| 🇳🇺 Niue | 25 | 67 | 2 |
| 🇰🇵 North Korea | 32,834 | 107,647 | 20,906 |
| 🇲🇰 North Macedonia | 1,695 | 15,578 | 4,214 |
| 🇳🇴 Norway | 106,043 | 134,172 | 87,736 |
| 🇴🇲 Oman | 6,764 | N/A | 15,640 |
| 🇵🇰 Pakistan | 1,809,000 | N/A | 1,223,000 |
| 🇵🇸 Palestine | 37,291 | N/A | 18,279 |
| 🇵🇦 Panama | 229,833 | 46,620 | 76,422 |
| 🇵🇬 Papua New Guinea | 6,725 | 82,783 | 3,153 |
| 🇵🇾 Paraguay | 75,054 | 69,442 | 522,776 |
| 🇵🇪 Peru | 1,751,608 | 176,150 | 189,923 |
| 🇵🇭 Philippines | 1,343,496 | 1,187,305 | 118,053 |
| 🇵🇱 Poland | 2,096,770 | 1,985,810 | 555,220 |
| 🇵🇹 Portugal | 300,040 | 380,290 | 103,000 |
| 🇵🇷 Puerto Rico | 30,146 | 6,558 | 5,396 |
| 🇶🇦 Qatar | 35,344 | N/A | 1,854 |
| 🇷🇴 Romania | 451,850 | 391,390 | 82,720 |
| 🇷🇺 Russia | 4,617,338 | 4,304,053 | 1,673,546 |
| 🇷🇼 Rwanda | 19,867 | 12,379 | 36,488 |
| 🇰🇳 Saint Kitts & Nevis | 28 | 50 | 52 |
| 🇱🇨 Saint Lucia | 1,320 | 846 | 415 |
| 🇻🇨 Saint Vincent & the Grenadines | 451 | 388 | 177 |
| 🇼🇸 Samoa | 402 | 1,909 | 981 |
| 🇸🇹 Sao Tome and Principe | 745 | 492 | 198 |
| 🇸🇦 Saudi Arabia | 910,000 | N/A | 40,000 |
| 🇸🇳 Senegal | 133,325 | 18,732 | 88,902 |
| 🇷🇸 Serbia | 110,528 | 312,167 | 69,785 |
| 🇸🇨 Seychelles | 430 | 397 | 11 |
| 🇸🇱 Sierra Leone | 20,581 | 1,316 | 11,278 |
| 🇸🇬 Singapore | 80,840 | 31,251 | 34 |
| 🇸🇰 Slovakia | N/A | 69,910 | 11,930 |
| 🇸🇮 Slovenia | 66,600 | 30,030 | 37,540 |
| 🇸🇧 Solomon Islands | 283 | 2,607 | 769 |
| 🇸🇴 Somalia | 3,909 | 96 | 43,661 |
| 🇿🇦 South Africa | 1,915,000 | 320,450 | 1,050,540 |
| 🇰🇷 South Korea | 935,000 | 1,407,000 | 310,000 |
| 🇸🇸 South Sudan | 20,374 | N/A | 131,417 |
| 🇪🇸 Spain | 1,331,410 | 5,180,060 | 717,880 |
| 🇱🇰 Sri Lanka | 230,616 | 2,371 | 19,500 |
| 🇸🇩 Sudan | 79,791 | N/A | 388,701 |
| 🇸🇷 Suriname | 12,332 | 2,125 | 1,821 |
| 🇸🇪 Sweden | 179,690 | 253,810 | 137,370 |
| 🇨🇭 Switzerland | 107,196 | 229,721 | 144,056 |
| 🇸🇾 Syria | 112,425 | N/A | 63,044 |
| 🇹🇼 Taiwan | 684,423 | 824,963 | 7,430 |
| 🇹🇯 Tajikistan | 30,900 | 4 | 214,273 |
| 🇹🇿 Tanzania | 86,206 | 41,468 | 508,355 |
| 🇹🇭 Thailand | 1,784,304 | 927,717 | 139,095 |
| 🇹🇱 Timor-Leste | 530 | 6,839 | 1,217 |
| 🇹🇬 Togo | 24,666 | 13,680 | 5,551 |
| 🇹🇰 Tokelau | 5 | 59 | N/A |
| 🇹🇴 Tonga | 280 | 1,802 | 353 |
| 🇹🇹 Trinidad & Tobago | 47,494 | 1,972 | 1,200 |
| 🇹🇳 Tunisia | 150,300 | 126 | 53,500 |
| 🇹🇷 Türkiye | 2,245,770 | N/A | 1,460,719 |
| 🇹🇲 Turkmenistan | 17,794 | 130 | 183,318 |
| 🇹🇻 Tuvalu | 64 | 127 | N/A |
| 🇺🇸 U.S. | 20,652,971 | 12,559,966 | 12,733,643 |
| 🇦🇪 UAE | 56,000 | N/A | 19,208 |
| 🇺🇬 Uganda | 68,385 | 127,602 | 193,661 |
| 🇬🇧 UK | 1,843,000 | 1,022,000 | 888,000 |
| 🇺🇦 Ukraine | 1,313,700 | 724,000 | 310,500 |
| 🇺🇾 Uruguay | 77,177 | 13,488 | 572,522 |
| 🇺🇿 Uzbekistan | 123,600 | 3,025 | 1,003,247 |
| 🇻🇺 Vanuatu | 676 | 3,390 | 2,133 |
| 🇻🇪 Venezuela | 439,847 | 110,253 | 371,426 |
| 🇻🇳 Viet Nam | 1,520,263 | 2,590,000 | 256,300 |
| 🇾🇪 Yemen | 205,941 | N/A | 96,354 |
| 🇿🇲 Zambia | 51,700 | 35,724 | 200,214 |
| 🇿🇼 Zimbabwe | 113,000 | 10,778 | 806,294 |
| 🇺🇳 World | 121,504,932 | 120,372,127 | 72,330,797 |
ℹ️ Data note: This data comes from FAOStat. For countries with no data in a production category, N/A has been assigned. However the database also assigns some countries “0” for certain meat productions. This has been left as is, for transparency.
Mapping Duck, Sheep, and Goat Livestock
Although chicken, beef, and pork are the most common types of livestock globally, there are other kinds of animals that have much more regional distributions.
In the following maps, you’ll see livestock concentrated in just a few places, usually following unique cultural connections to these animals.
Duck Livestock Density
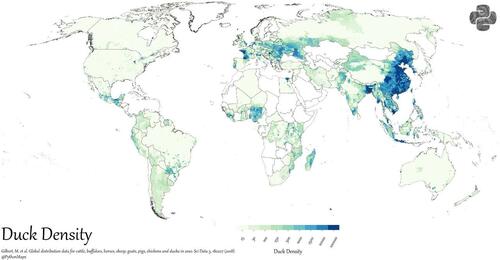
Compared to chicken above, ducks are much less widespread in farming and usage.
Click to view this graphic in a higher-resolution.
China is the runaway king when it comes to both duck livestock and meat production. The country accounted for 78% of global duck meat production in 2021—but distant runners up Vietnam and France also show strong concentrations of duck.
Perhaps surprising to some is the strong foothold duck has in Bangladesh. Farmers in the country have embraced duck over the past decades as both a more profitable bird, and more recently, as an adaptation to climate change.
Sheep Livestock Density
Moving to sheep, which provide meat, milk, and wool, we once again have a widespread global population. However, the regions with the highest densities have wildly changed.
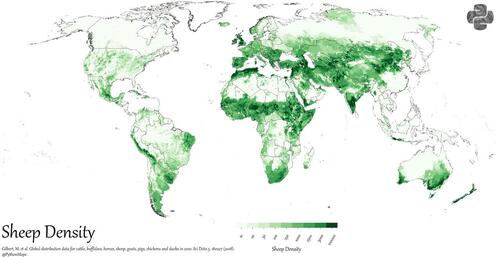
Click to view this graphic in a higher-resolution.
Sheep can be seen in higher numbers throughout North and Central Africa, the Middle East, and Central Asia. Australia, New Zealand, and the UK also stand out in their regions for higher concentrations of sheep.
Goat Livestock Density
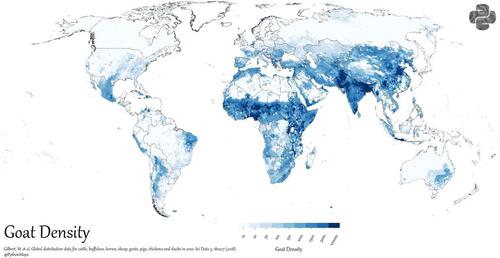
Click to view this graphic in a higher-resolution.
Goats have their highest concentrations in North India, North China, Mongolia, and many countries across Africa. Nigeria in particular has a strong goat farming industry.
Here’s a breakdown of duck, sheep, and goat meat production by country in 2021.
| Territory | Sheep (Tons) | Goat (Tons) | Duck (Tons) |
|---|---|---|---|
| 🇦🇫 Afghanistan | 109,931 | 47,212 | N/A |
| 🇦🇱 Albania | 15,725 | 7,208 | N/A |
| 🇩🇿 Algeria | 342,295 | 18,929 | N/A |
| 🇦🇴 Angola | 4,747 | 20,443 | N/A |
| 🇦🇬 Antigua & Barbuda | 4 | 3 | N/A |
| 🇦🇷 Argentina | 51,806 | 7,185 | 9,867 |
| 🇦🇲 Armenia | 10,872 | 29 | N/A |
| 🇦🇺 Australia | 656,750 | 16,380 | 15,167 |
| 🇦🇹 Austria | 6,750 | 670 | N/A |
| 🇦🇿 Azerbaijan | 87,647 | N/A | N/A |
| 🇧🇸 Bahamas | 30 | 74 | N/A |
| 🇧🇭 Bahrain | 25,028 | 243 | N/A |
| 🇧🇩 Bangladesh | 5,114 | 229,580 | 60,461 |
| 🇧🇧 Barbados | 65 | 30 | N/A |
| 🇧🇾 Belarus | 1,200 | N/A | 3,500 |
| 🇧🇪 Belgium | 2,740 | 390 | 100 |
| 🇧🇿 Belize | 38 | 1 | 15 |
| 🇧🇯 Benin | 8,375 | 8,404 | N/A |
| 🇧🇹 Bhutan | 161 | 364 | N/A |
| 🇧🇴 Bolivia | 30,374 | 7,374 | 1,977 |
| 🇧🇦 Bosnia & Herzegovina | 1,332 | N/A | 0 |
| 🇧🇼 Botswana | 1,059 | 4,164 | N/A |
| 🇧🇷 Brazil | 102,555 | 38,666 | 6,914 |
| 🇧🇳 Brunei Darussalam | 30 | 41 | 240 |
| 🇧🇬 Bulgaria | 8,690 | 1,890 | 19,860 |
| 🇧🇫 Burkina Faso | 23,830 | 51,046 | N/A |
| 🇧🇮 Burundi | 804 | 8,570 | N/A |
| 🇨🇻 Cabo Verde | 77 | 1,209 | N/A |
| 🇰🇭 Cambodia | N/A | N/A | 10,355 |
| 🇨🇲 Cameroon | 15,532 | 19,052 | 0 |
| 🇨🇦 Canada | 17,765 | N/A | 9,326 |
| 🇨🇫 Central African Republic | 2,513 | 23,874 | N/A |
| 🇹🇩 Chad | 206,070 | 139,815 | N/A |
| 🇨🇱 Chile | 8,210 | 4,885 | N/A |
| 🇨🇳 China | 2,621,800 | 2,519,000 | 4,823,000 |
| 🇨🇴 Colombia | 572 | 434 | N/A |
| 🇰🇲 Comoros | 96 | 377 | N/A |
| 🇨🇩 Congo | 451 | 1,068 | N/A |
| 🇨🇰 Cook Islands | N/A | 1 | N/A |
| 🇨🇷 Costa Rica | 15 | 254 | N/A |
| 🇨🇮 Côte d’Ivoire | 8,987 | 8,933 | N/A |
| 🇭🇷 Croatia | 5,610 | 500 | N/A |
| 🇨🇺 Cuba | 16,300 | 8,200 | N/A |
| 🇨🇾 Cyprus | 2,620 | 2,530 | 0 |
| 🇨🇿 Czechia | 3,170 | 260 | N/A |
| 🇩🇰 Denmark | 1,300 | N/A | 0 |
| 🇩🇯 Djibouti | 2,242 | 2,296 | N/A |
| 🇩🇲 Dominica | 26 | 41 | N/A |
| 🇩🇴 Dominican Republic | 915 | 855 | N/A |
| 🇨🇩 DRC | 2,839 | 18,664 | N/A |
| 🇪🇨 Ecuador | 6,495 | 669 | 560 |
| 🇪🇬 Egypt | 55,783 | 13,941 | 41,817 |
| 🇸🇻 El Salvador | 37 | 78 | N/A |
| 🇬🇶 Equatorial Guinea | 107 | 50 | N/A |
| 🇪🇷 Eritrea | 6,721 | 6,311 | N/A |
| 🇪🇪 Estonia | 340 | 10 | 0 |
| 🇸🇿 Eswatini | 704 | 1,620 | N/A |
| 🇪🇹 Ethiopia | 141,177 | 154,233 | N/A |
| 🇫🇴 Faroe Islands | 590 | N/A | N/A |
| 🇫🇯 Fiji | 146 | 186 | 406 |
| 🇫🇮 Finland | 1,320 | N/A | 0 |
| 🇫🇷 France | 81,790 | 6,210 | 177,000 |
| 🇵🇫 French Polynesia | 3 | 71 | 32 |
| 🇬🇦 Gabon | 862 | 352 | N/A |
| 🇬🇲 Gambia | 311 | 892 | N/A |
| 🇬🇪 Georgia | 4,400 | N/A | 100 |
| 🇩🇪 Germany | 33,360 | 450 | 21,871 |
| 🇬🇭 Ghana | 25,232 | 31,212 | N/A |
| 🇬🇷 Greece | 63,780 | 22,090 | 30 |
| 🇬🇩 Grenada | 114 | 27 | N/A |
| 🇬🇹 Guatemala | 2,096 | 217 | N/A |
| 🇬🇳 Guinea | 10,822 | 17,091 | N/A |
| 🇬🇼 Guinea-Bissau | 1,264 | 980 | N/A |
| 🇬🇾 Guyana | 562 | 273 | N/A |
| 🇭🇹 Haiti | 1,618 | 5,318 | 217 |
| 🇭🇳 Honduras | 102 | 155 | N/A |
| 🇭🇰 Hong Kong | 0 | 93 | 508 |
| 🇭🇺 Hungary | 1,270 | 100 | 89,640 |
| 🇮🇸 Iceland | 9,388 | N/A | N/A |
| 🇮🇳 India | 276,379 | 547,915 | 44,000 |
| 🇮🇩 Indonesia | 55,863 | 61,725 | 44,198 |
| 🇮🇷 Iran | 238,135 | 38,424 | 2,843 |
| 🇮🇶 Iraq | 46,893 | 11,605 | N/A |
| 🇮🇪 Ireland | 63,430 | 0 | N/A |
| 🇮🇱 Israel | 39,374 | 3,383 | 2,352 |
| 🇮🇹 Italy | 29,420 | 2,250 | 2,850 |
| 🇯🇲 Jamaica | 5 | 481 | N/A |
| 🇯🇵 Japan | 215 | 36 | N/A |
| 🇯🇴 Jordan | 27,297 | 6,500 | 118 |
| 🇰🇿 Kazakhstan | 155,403 | 20,107 | 335 |
| 🇰🇪 Kenya | 50,842 | 73,063 | N/A |
| 🇰🇮 Kiribati | N/A | N/A | N/A |
| 🇰🇼 Kuwait | 52,034 | 1,063 | N/A |
| 🇰🇬 Kyrgyzstan | 70,955 | 8,881 | N/A |
| 🇱🇦 Laos | N/A | 2,826 | 4,592 |
| 🇱🇻 Latvia | 800 | 50 | N/A |
| 🇱🇧 Lebanon | 4,534 | 3,053 | N/A |
| 🇱🇸 Lesotho | 471 | 239 | N/A |
| 🇱🇷 Liberia | 929 | 1,113 | 360 |
| 🇱🇾 Libya | 29,565 | 11,901 | N/A |
| 🇱🇹 Lithuania | 1,080 | 50 | N/A |
| 🇱🇺 Luxembourg | 50 | 0 | N/A |
| 🇲🇴 Macao | N/A | 26 | 18 |
| 🇲🇬 Madagascar | 1,298 | 3,287 | 13,067 |
| 🇲🇼 Malawi | 1,675 | 63,881 | N/A |
| 🇲🇾 Malaysia | 1,937 | 1,682 | 66,644 |
| 🇲🇱 Mali | 7,182 | 11,935 | N/A |
| 🇲🇹 Malta | 150 | 20 | N/A |
| 🇲🇷 Mauritania | 38,874 | 19,821 | N/A |
| 🇲🇺 Mauritius | 22 | 16 | 45 |
| 🇲🇽 Mexico | 65,846 | 40,480 | N/A |
| 🇫🇲 Micronesia | N/A | 14 | N/A |
| 🇲🇩 Moldova | 1,348 | N/A | N/A |
| 🇲🇳 Mongolia | 149,160 | 96,535 | N/A |
| 🇲🇪 Montenegro | 1,039 | 93 | N/A |
| 🇲🇦 Morocco | 179,000 | 31,000 | N/A |
| 🇲🇿 Mozambique | 341 | 2,276 | 3,545 |
| 🇲🇲 Myanmar | 2,000 | 10,000 | 55,000 |
| 🇳🇦 Namibia | 6,594 | 3,594 | N/A |
| 🇳🇷 Nauru | N/A | N/A | N/A |
| 🇳🇵 Nepal | 2,964 | 70,755 | 442 |
| 🇳🇱 Netherlands | 15,620 | 2,840 | N/A |
| 🇳🇨 New Caledonia | 9 | 1 | N/A |
| 🇳🇿 New Zealand | 454,198 | 1,997 | 659 |
| 🇳🇮 Nicaragua | 24 | 37 | N/A |
| 🇳🇪 Niger | 19,313 | 30,799 | N/A |
| 🇳🇬 Nigeria | 151,291 | 257,519 | N/A |
| 🇳🇺 Niue | N/A | N/A | N/A |
| 🇰🇵 North Korea | 1,025 | 13,848 | 13,027 |
| 🇲🇰 North Macedonia | 3,097 | N/A | N/A |
| 🇳🇴 Norway | 24,369 | 349 | 586 |
| 🇴🇲 Oman | 32,152 | 18,176 | N/A |
| 🇵🇰 Pakistan | 247,000 | 518,000 | 5,155 |
| 🇵🇸 Palestine | 11,977 | 4,540 | N/A |
| 🇵🇦 Panama | N/A | N/A | N/A |
| 🇵🇬 Papua New Guinea | 32 | 10 | 16 |
| 🇵🇾 Paraguay | 1,778 | 786 | 1,932 |
| 🇵🇪 Peru | 33,259 | 4,948 | N/A |
| 🇵🇭 Philippines | 117 | 32,136 | 21,879 |
| 🇵🇱 Poland | 1,140 | 40 | 57,450 |
| 🇵🇹 Portugal | 15,930 | 1,250 | 9,720 |
| 🇵🇷 Puerto Rico | 19 | 11 | N/A |
| 🇶🇦 Qatar | 8,159 | 1,121 | 29 |
| 🇷🇴 Romania | 53,560 | 3,830 | 0 |
| 🇷🇺 Russia | 196,826 | 18,648 | N/A |
| 🇷🇼 Rwanda | 4,561 | 10,128 | N/A |
| 🇰🇳 Saint Kitts & Nevis | 9 | 7 | N/A |
| 🇱🇨 Saint Lucia | 99 | 62 | N/A |
| 🇻🇨 Saint Vincent & the Grenadines | 43 | 35 | N/A |
| 🇼🇸 Samoa | N/A | N/A | N/A |
| 🇸🇹 Sao Tome & Principe | 3 | 9 | 38 |
| 🇸🇦 Saudi Arabia | 90,578 | 52,861 | N/A |
| 🇸🇳 Senegal | 42,082 | 17,172 | N/A |
| 🇷🇸 Serbia | 27,604 | 3,257 | 110 |
| 🇸🇨 Seychelles | N/A | 22 | 6 |
| 🇸🇱 Sierra Leone | 2,047 | 1,622 | 2,463 |
| 🇸🇬 Singapore | 23 | 10 | 3,963 |
| 🇸🇰 Slovakia | 360 | 300 | N/A |
| 🇸🇮 Slovenia | 1,410 | 360 | 0 |
| 🇸🇧 Solomon Islands | N/A | N/A | N/A |
| 🇸🇴 Somalia | 43,693 | 39,664 | N/A |
| 🇿🇦 South Africa | 148,000 | 11,870 | 1,208 |
| 🇰🇷 South Korea | 5 | 2,434 | 74,968 |
| 🇸🇸 South Sudan | 18,810 | 24,707 | 49,008 |
| 🇪🇸 Spain | 120,390 | 10,130 | 5,000 |
| 🇱🇰 Sri Lanka | 127 | 757 | 27 |
| 🇸🇩 Sudan | 267,866 | 119,217 | N/A |
| 🇸🇷 Suriname | 13 | 7 | 800 |
| 🇸🇪 Sweden | 5,180 | 10 | N/A |
| 🇨🇭 Switzerland | 5,096 | 518 | N/A |
| 🇸🇾 Syria | 160,446 | 10,503 | 25 |
| 🇹🇼 Taiwan | N/A | 88,949 | 78,867 |
| 🇹🇯 Tajikistan | N/A | 79,826 | N/A |
| 🇹🇿 Tanzania | 30,640 | 71,500 | 1,328 |
| 🇹🇭 Thailand | 155 | 1,973 | 59,803 |
| 🇹🇱 Timor-Leste | 67 | 574 | N/A |
| 🇹🇬 Togo | 9,242 | 3,998 | N/A |
| 🇹🇰 Tokelau | N/A | N/A | N/A |
| 🇹🇴 Tonga | N/A | 28 | N/A |
| 🇹🇹 Trinidad & Tobago | 64 | 41 | N/A |
| 🇹🇳 Tunisia | 56,400 | 10,800 | N/A |
| 🇹🇷 Türkiye | 385,933 | 94,555 | 639 |
| 🇹🇲 Turkmenistan | 123,611 | 10,037 | N/A |
| 🇹🇻 Tuvalu | N/A | N/A | N/A |
| 🇺🇸 U.S. | 64,774 | 8,824 | 43,378 |
| 🇦🇪 UAE | 4,060 | 63,189 | N/A |
| 🇺🇬 Uganda | 8,360 | 31,787 | N/A |
| 🇬🇧 UK | 267,000 | N/A | 21,300 |
| 🇺🇦 Ukraine | 6,800 | 5,400 | 22,000 |
| 🇺🇾 Uruguay | 24,074 | N/A | N/A |
| 🇺🇿 Uzbekistan | 169,134 | N/A | N/A |
| 🇻🇺 Vanuatu | N/A | 32 | N/A |
| 🇻🇪 Venezuela | 3,342 | 6,593 | 49 |
| 🇻🇳 Viet Nam | N/A | 21,349 | 182,651 |
| 🇾🇪 Yemen | 45,199 | 84,516 | N/A |
| 🇿🇲 Zambia | 703 | 15,195 | N/A |
| 🇿🇼 Zimbabwe | 2,582 | 28,010 | 48 |
| 🇺🇳 World | 9,880,040 | 6,477,574 | 6,191,507 |
The Future of the Global Livestock Industry
How is the livestock industry expected to change, going forward?
For starters, the UN estimates that global meat consumption is projected to rise 14% by 2030, driven primarily by population growth. That growth will occur unevenly, from a 30% jump in Africa to a 0.4% in Europe.
At the same time, emissions from the livestock sector have increasingly come under fire in recent years, and the industry is projected to register a 5% increase by 2030.
All these factors, alongside growth in plant-based meat and cultured meat, may change livestock distribution over the coming decade.
Read the full article here


‘Googlers against genocide’ lead sit-ins, protests coast-to-coast at tech giant’s offices

Will Trump’s Criminal Trials Matter in November?

Stephen A. Smith: ‘Get Trump’ Lawfare Is Proof Democrats ‘Scared’ & ‘Can’t Beat Him On The Issues’

REALLY? Singer John Legend Claims Trump is ‘Benefiting’ From Two-Tiered Justice System (VIDEO)

Two Juveniles Accused of Vandalizing Catholic Church in Kentucky

Greg Kelly: Joe Biden isn’t a man of ‘excellence’ or ‘skill’

Ted Nugent: ATF ‘has lost its soul’

Carl Higbie: There is ‘no open mind’ at NPR anymore

I would support FISA reform, constraints on FBI: Harriet Hageman | The Chris Salcedo Show
